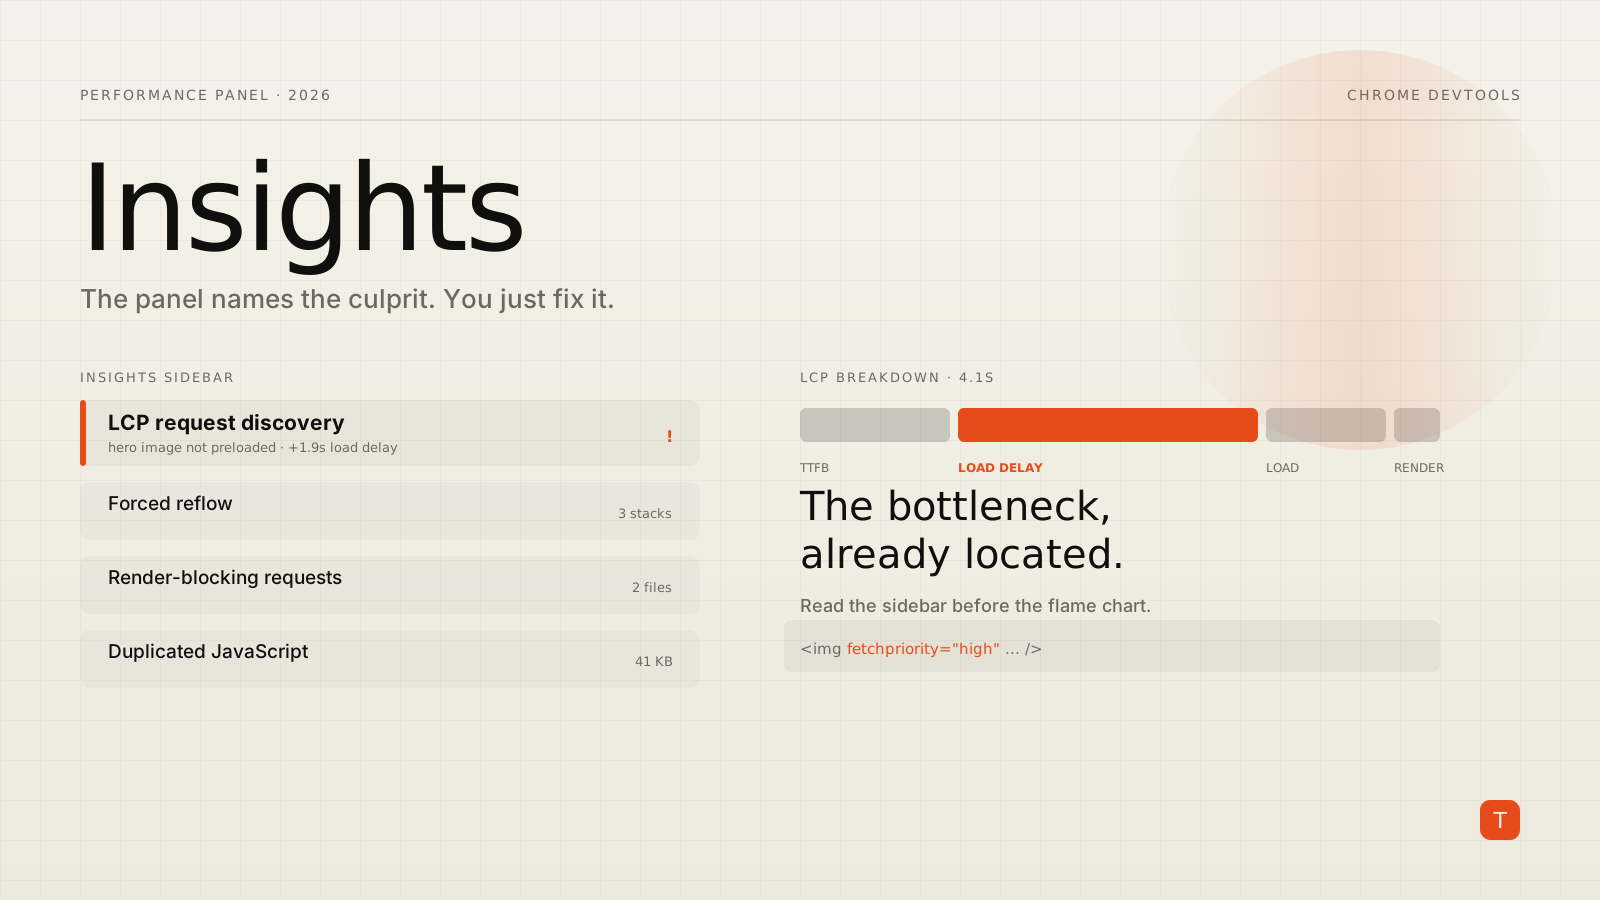
Most performance work still starts the same way it did a decade ago: open the profiler, record a trace, and stare at a flame chart until something looks wrong. That approach rewards people who already know what a forced reflow or a render-blocking request looks like in a timeline, and it quietly punishes everyone else. The Chrome DevTools team has spent the last several releases trying to close that gap, and the result is Performance Insights — a growing catalog of automated checks that read your trace and tell you, in plain language, what is slowing the page down and which element or request is to blame.
The important shift is that Insights are no longer a separate experiment bolted onto the side of the profiler. They now live directly in the Performance panel's sidebar and are surfaced by Lighthouse too, so the same analysis shows up whether you record an interaction by hand or run an automated audit. In the Chrome 150 DevTools release, the team moved timeline invalidation tracking out of experimental flags into standard settings and fixed re-rendering bugs in the Insights sidebar — housekeeping that signals a feature graduating from preview to something you rely on daily.
What an Insight actually gives you
A traditional trace tells you when things happened. An Insight tells you why it mattered and what to do. Each one ties a measured problem to a Core Web Vital and, crucially, to the specific culprit — a DOM node, a network request, a script, or a stylesheet — rather than leaving you to reverse-engineer the connection.
Record a trace of a page load or an interaction and the sidebar populates with the Insights that apply. The ones you will reach for most map cleanly onto the three Core Web Vitals:
- LCP breakdown splits your Largest Contentful Paint into its subparts — time to first byte, resource load delay, resource load time, and element render delay — so you can see whether the problem is your server, your discovery, or your rendering.
- LCP request discovery flags the common case where the LCP image is not discoverable early, because it is lazy-loaded, injected by script, or missing a
fetchpriorityhint. - INP breakdown decomposes your worst interaction into input delay, processing time, and presentation delay, pointing at whichever segment is eating the budget.
- Layout shift culprits names the exact DOM elements responsible for movement that feeds Cumulative Layout Shift, instead of just reporting a score.
Around those sit a set of load-time and main-thread checks: Render-blocking requests, Forced reflow, Network dependency tree, Document request latency, Third parties, Duplicated JavaScript, and Legacy JavaScript, among others. Each is a named, documented condition with a fix attached.
Reading an LCP problem end to end
Say your product page reports a 4.1-second LCP in the field and you want to know why. Record a page load, open the LCP breakdown Insight, and you get the four subparts laid out with real numbers. In practice most bad LCP scores fall into one of two buckets, and the breakdown tells you which.
If time to first byte dominates, the page is slow before the browser has anything to paint, and no amount of front-end tuning will save you — that is a server, CDN, or caching problem. If TTFB is fine but load delay is large, the browser found out about the LCP resource too late. That is where the LCP request discovery Insight earns its place: it will tell you the hero image was not in the initial HTML or lacked a priority hint. The fix is usually to make the resource discoverable in the markup and mark it as important:
<!-- Discoverable in the initial HTML, fetched eagerly, prioritized -->
<link rel="preload" as="image"
      href="/hero-1200.avif"
      fetchpriority="high" />

<img src="/hero-1200.avif"
     alt="Product overview"
     fetchpriority="high"
     decoding="async" />
The pattern the Insight steers you away from is the hero set as a background image in a late-loading stylesheet, or an <img loading="lazy"> above the fold that the browser deprioritizes. Neither is discoverable during the preload scan, so both inflate load delay — and the tooling now says so directly instead of leaving you to infer it from the waterfall.
Killing forced reflows on the interaction path
The Forced reflow Insight is the one that most often surprises teams, because the cost is invisible in the code. A forced synchronous layout happens when your JavaScript writes to the DOM and then reads a geometric property in the same frame, forcing the browser to recompute layout on the spot to answer the read. Do it once and it is cheap. Do it in a loop and you have serialized dozens of layout passes onto the main thread — a classic cause of a poor Interaction to Next Paint score.
The anti-pattern usually hides inside an innocent-looking loop:
// Layout thrash: every iteration writes, then reads back geometry
for (const card of cards) {
  card.style.width = card.offsetParent.offsetWidth + 'px'; // write
  card.style.height = card.offsetHeight + 'px';            // read forces layout
}
The fix is to batch reads and writes so the browser only lays out once. Measure everything first, then mutate everything:
// Read phase — no writes, so layout is computed at most once
const sizes = cards.map((card) => ({
  card,
  width: card.offsetParent.offsetWidth,
  height: card.offsetHeight,
}));

// Write phase — no reads, so nothing forces a synchronous reflow
for (const { card, width, height } of sizes) {
  card.style.width = width + 'px';
  card.style.height = height + 'px';
}
When the Forced reflow Insight fires, it points at the call stack that triggered the layout, so you can jump straight to the offending function instead of hunting for read-after-write pairs by eye. That is the difference between a five-minute fix and an afternoon of bisecting a component tree.
The checks that quietly compound
Not every Insight is about a single dramatic bottleneck. Several exist to catch the slow, boring regressions that accumulate as a codebase ages:
- Duplicated JavaScript pinpoints identical modules loaded more than once — the usual symptom of two dependencies bundling different copies of the same library. On a large app this can be tens of kilobytes of parse and execution cost that no one intended to ship.
- Legacy JavaScript flags transpiled polyfills and down-levelled syntax that modern browsers no longer need — dead weight for the vast majority of your users.
- Modern HTTP checks whether resources are served over HTTP/2 or HTTP/3, since head-of-line blocking on HTTP/1.1 still throttles request-heavy pages.
- Use efficient cache lifetimes surfaces assets with short or missing cache headers that force needless re-downloads on repeat visits.
- Optimize DOM size warns when the element count climbs high enough to slow style and layout on every frame.
None of these will show up as a single tall bar in a flame chart. They show up as a page that is just a bit slower than it should be, everywhere, all the time — exactly the class of problem that automated Insights are good at catching and humans are bad at noticing.
Putting it into a workflow
The practical value here is that Insights turn performance from a specialist skill into a checklist any engineer can run. A reasonable loop: record a trace of the specific interaction or load you care about, not a generic homepage hit. Read the Insights sidebar top to bottom before you touch the flame chart, and treat each fired Insight as a ticket with the culprit attached. Fix the Core Web Vital breakdowns first, since they map to what users feel, then work through the compounding checks. Re-record after each change to confirm the Insight actually cleared. Because the same analysis runs in Lighthouse, you can wire the audit into CI and catch regressions before they ship instead of in field data weeks later.
The flame chart is not going away, and there is still no substitute for understanding what the main thread is doing frame by frame. But for the day-to-day work of finding out why a page is slow and who is responsible, DevTools now does the first pass for you. The teams that get the most out of it are the ones who read the Insights first and reach for the timeline only when the automated answer is not specific enough.
Takeaways
Open the Performance panel, record the real interaction, and read the Insights sidebar before the flame chart — each Insight names the culprit so you skip the detective work. Start with the Core Web Vital breakdowns: use LCP breakdown and LCP request discovery to decide whether your problem is server, discovery, or rendering, and make the LCP resource discoverable with preload and fetchpriority="high". When Forced reflow fires, batch your DOM reads and writes to get layout off the interaction hot path. Let the compounding checks — Duplicated JavaScript, Legacy JavaScript, Modern HTTP, and cache lifetimes — clean up the slow-everywhere regressions that never surface as a single spike. Then move the same analysis into Lighthouse and CI so the checks run on every build, not just when someone remembers to profile.
Sources: Chrome for Developers: Performance Insights · What's new in DevTools (Chrome 150) · Chrome for Developers: Lighthouse performance audits